In Part One of our Challenges of Fixed Income Surveillance Thought Leadership series, we discussed the difficulties of fixed income trade surveillance and the need to move from expressing risk as inventory (i.e., in terms of summing up the notional amounts of each of the bonds you hold) and into standardised risk measures, otherwise known as greeks or sensitivities.
In Part Two, we considered how market impact models could quantify a trader’s intent to manipulate markets. We also explained how quantification is crucial for prioritising the risks identified and ensuring that the highest risk cases are investigated first.
Part Three will discuss market abuse utilising multiple products, also known as cross-product abuse, with a focus on the fixed income asset class. We will explain how combining the techniques outlined in the previous parts, and overlaying them with broader fixed income market modelling, is crucial for the identification of this type of sophisticated market abuse.
The Regulatory Landscape
In recent years, global regulators have increasingly focused their attention on cross-product and cross-market manipulation. Fines in the hundreds of millions of dollars relating to cross-product manipulation are becoming commonplace.
An important takeaway from these numbers is that they represent the fines levied under the jurisdiction of the regulator and not the headquartered location of the institution itself. Regulatory action is becoming borderless. We have also seen enforcement action in cases where the incident took place outside a particular regulator’s remit through joint action with fellow regulators.
The increasing difficulty of identifying sophisticated market abuse given the variety of financial products, platforms and execution venues in existence, is widely acknowledged. When surveillance programs undergo internal or regulatory reviews, the most frequent diagnosis is a gap in surveillance capabilities in over-the-counter (OTC) trading activity. This is because traditional surveillance systems are focused on exchange traded, or lit, markets and have avoided OTC markets due to their complexity, opacity and bespoke nature. Asset classes likefixed income, and in turn any products which require risk-based methodologies, are by nature challenging to surveil using basic surveillance methodology. Unfortunately, due to the complexity of these markets and products, opportunities are opened for bad actors to engage in manipulative behaviour. As such, they must receive our strongest focus.
Refresher: Risk vs Inventory
Let’s briefly recap the concepts raised in Part One. Our key message is that fixed income traders generally do not think in terms of inventory, they think in terms of risk.
Every bond, bond future and interest rate swap can be considered as forming part of a shared yield curve, otherwise known as an interest rate curve. Bonds which carry credit risk are also considered to form part of a second curve, known as a credit curve. More on this later.
Taking the example of a bond, we know that when yields increase, bond prices fall. If we artificially shift the yield curve up by 0.01% (otherwise known as 1 basis point or 1bp) then revalue our bond, we can calculate the exact loss generated when the curve moves.
If we do this for all our bond positions and add the results, we can see the total gain or loss expressed in actual dollar amounts, for our entire inventory of bonds. This technique can similarly be applied to bond futures, options and interest rate swaps. Indeed, the technique is applicable to any security or derivative with a price that depends on interest rates. Applying the approach to all the instruments in a trading book allows us to calculate the total interest rate exposure of the book.
Yield Curve Risk and General Market Models
Traders generally understand that it is rare for each point on a yield curve to move independently of the others and they make use of this property. Offsetting the risk of a 6yr Treasury Bond with a 5yr Treasury Bond Future is usually considered a reasonable hedge (at least in the short term), if the aggregate exposure to a parallel shift in the yield curve is zero.
However, traders also understand that yield curves do not always move in a parallel fashion, yields across all maturities can move by the same amount. Yield curves can also steepen or flatten, for example where yields of long maturity bonds move in the opposite direction to yields of short-dated bonds. In this case, offsetting exposures in different maturities is much less effective.
To capture this complexity, the exposure calculations described above can be extended. Rather than shifting the entire curve in parallel and calculating the P&L, instead we can move (blip) each point individually to better understand exactly where the risk sits along the yield curve. This technique helps us understand the P&L generated in a trading book when each point on the yield curve moves.
Yield curve modelling seeks to demonstrate that the value of all instruments with a price that depends on the level of interest rates in a particular currency are linked. If interest rates rise, all interest rate sensitive instruments will be affected. Similarly, if the yield curve steepens or flattens, all interest rate sensitive instruments will be affected, though the results will be different.
Additionally, Correlation Modelling (or General Market Modelling), seeks to capture the fact that market impact at one point on the yield curve spreads out across the rest of the curve. For example, a large trade executed at the fiveyear point moves the yield of the 5yr point but is also very likely to move the 3yr, 4yr, 6yr and 7yr points. This modelling is necessary to capture the reality of yield curve moves and to understand the decision the trader made in our previous example to hedge a 6yr bond with a 5yr bond future.
This approach provides a framework within which we can model the market impact of a trade, or combination of trades across the entire curve.
Cross-Asset Abuse
Consider a trader working a large 8 ½yr US Dollar interest rate swap order for a customer. For this purpose, let us assume that the customer places an order with a trader whereby the customer wishes to receive fixed rate (and pay floating rate) on a USD 2,000,000,000 swap with an 8 ½yr maturity. The trader is given an hour to fill the order. Ideally, filling this order would involve the trader building a position in 8 1/2yr swaps via street trades and then entering an offsetting position with the customer. This would perfectly offset the accumulated risk and fill the customer’s order, leaving the trader with no residual risk.
However, 8 1/2yr interest rate swaps are non-standard instruments and are unlikely to trade in the interbank market. As such, attempting to build a precise offsetting position is not plausible and the trader needs to find another approach. The alternative is to use a series of different instruments, such as US Treasuries, Treasury futures and swaps with close but differing maturities to accumulate the necessary amount of risk. A possible combination might include 5yr, 7yr and 10yr swaps. Once a sufficiently large position has been created, the trader can enter into the 8 ½yr swap with the customer and fulfil the order.
When building such a position, the trader knows implicitly that the 5yr, 7yr, 8 ½yr and 10yr swap points do not move independently of each other. The trader knows that the instruments are all closely linked and generally move in tandem. The trader is therefore able to carry this combination of trades in their portfolio for a few hours or even days as a reasonably hedged position.
Such an approach might look as follows.
Before filling the order, the trader executes the following hedges over the course of an hour:
This combination of trades produces the following risk profile:
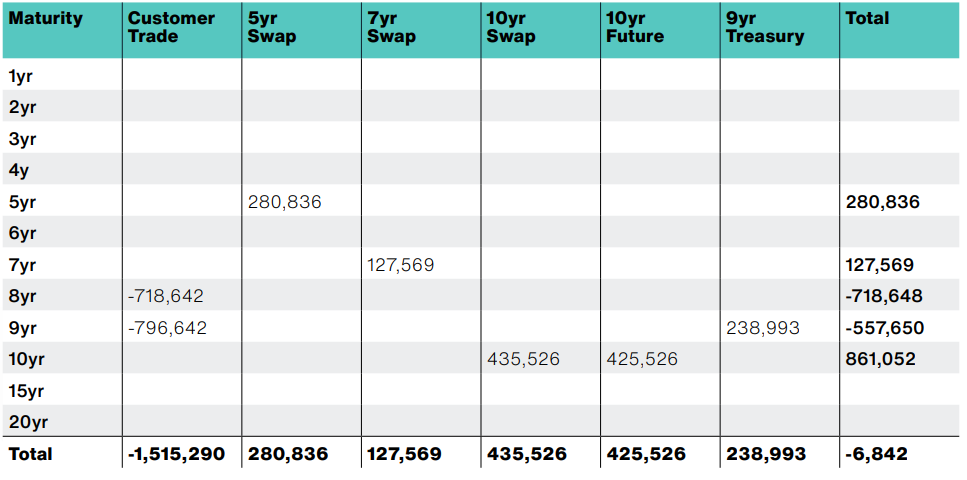
The customer trade represents USD 1,515,290 of profit or loss per basis point move in the yield curve. Seen in isolation, if the 8yr and 9yr points on the yield curve both decrease by 0.01%, the trader would make a loss of USD 1,515,290 on the customer trade. To offset this, the trader entered into a series of hedges which together generate a profit of USD 1,508,499 per basis point decrease in the yield curve. The overall combination of customer trades and hedges reduces the risk to almost zero, leaving a residual of USD 6,842 per basis point – thus a loss if yields decrease or a profit if yields increase.
Executing this combination of very large trades over an hour will have an impact on market prices. The extent of the impact will depend upon market conditions at the time of execution, and will vary with time of day and the day of the week, but a plausible impact is shown below.
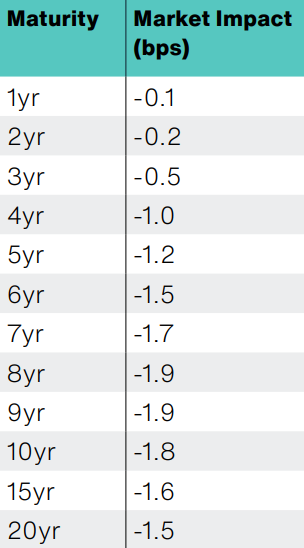
Suppose now that our trader decided to front run the customer order by buying 500 10yr note futures contracts as a proprietary position just before executing the hedges for the customer trade.
Such a trade represents approximately USD 43,000 per basis of risk (a profit if yields fall). We can see from the table that we could reasonably expect the customer trade to move the 10yr yield down by 1.8bp if facilitated. Once the customer hedges were executed and market prices impacted, the trader would buy back the 500 futures contracts and expect to profit by approximately USD 77,000 from this abusive strategy.
When monitoring the execution of this order for possible front running by the trader, a complete picture of all the risk taken is required. Capturing the trades in each instrument in isolation would create a false impression of what occurred. Dangerously, this would mean no red flags would be generated even if substantial front running of the order occurred, as was the case here.
This example clearly demonstrates the need for a multi-layered approach to cross-asset abuse detection. In summary, these layers are:
Without all four of these components, any attempt at cross-asset abuse detection is destined to fail.
Summary
It is clear from our discussion that the ability to understand how different interest rate sensitive instruments move in related ways is essential to discover cross-instrument abuse.
General market modelling allows us to understand how the trader’s positions across a combination of instruments (bonds, futures and swaps) and across a series of maturities are all linked and share risk commonalities.
Furthermore, market impact modelling allows us to quantify how a trader’s positions may benefit from illicitly-induced market moves and to quantify any such gain.
Crucially, this approach not only discovers true positives that would be otherwise missed, but also drives a substantial reduction in false positives. For example, in the presence of large rates moves, separately analysing a buy trade in a 5yr bond and a pay fixed trade in a 5yr swap might generate insider trading alerts. However, when considered together, the offsetting nature of the risk demonstrates that nothing suspicious occurred.
Finally, our examples show how the technique can be applied to instruments which depend on a shared yield curve. It should now be apparent how this approach can be extended to instruments which also depend on a shared credit curve. For example, bonds issued by General Motors and credit default swaps on General Motors are both linked through the General Motors credit curve or a shared forwards curve, such as in the case of commodities.
Conclusion
General Market Modelling is a necessary step in the journey toward holistic market abuse surveillance.
The ability to understand how broad curve movements across fixed income markets may benefit a variety of aggregated positions across product types drives a much more profound analysis. The approach significantly reduces false positives and crucially detects abuse that otherwise would have been missed. In this article, we have focused on the use of a General Market Model in fixed income. However, parallels exist in all other asset classes and the techniques described here can be extended and used in all cases.
Part One: Why Fixed Income is Different is available to read now.


-1.png?length=1440&upsize=true&upscale=true&name=MicrosoftTeams-image%20(5)-1.png)